COP27 Diary: Updates from Day 1

What happened that you should know, and what you should watch out for.

Kochi: The 27th UN climate summit kicked off at the tourist city of Sharm el-Sheikh in Egypt on November 6. Earlier, Egypt lit up Khafre Pyramid, one of the three pyramids of Giza, to welcome the participating countries.

However, the opening faced a delay of several hours as negotiators worked to agree on the COP and the CMA agendas.

‘COP’ is short for ‘Conference of the Parties’ to the UN Framework Convention on Climate Change. The convention currently has 198 parties. When they meet every year, they constitute the chief decision-making event of the convention. Their meetings are numbered COP1, COP2, etc.

‘CMA’ is short for ‘Conference of the Parties serving as the meeting of the Parties to the Paris Agreement’ – i.e. the group of countries that have ratified the Paris Agreement. Their meetings are called CMA1, CMA2, etc.

In the opening ceremony, Egypt took over the presidency of the conference from the United Kingdom. Egypt foreign minister Sameh Shoukry was elected COP27 president. The 28th COP will be hosted by the government of the United Arab Emirates from November 6 to 17, 2023.

‘Loss and damage’ on agenda

For the first time in the history of COPs, ‘loss and damage’ is now on the provisional agenda of discussion on matters relating to finance.

‘Losses and damages’ refers to the consequences of the climate crisis, “beyond natural climate variability”, on nature and people, according to the UN. “These include economic and non-economic losses due to extreme weather events as well as slow-onset events like sea-level rise.”

The participating countries agreed that the sub-agenda item on “matters relating to funding arrangements responding to loss and damage associated with the adverse effects of climate change, including a focus on addressing loss and damage”, based on a proposal received from Pakistan on behalf of the G77 countries and China, be included in the provisional agenda.

However, it won’t involve liability or binding compensation, and a conclusive decision has to be reached by 2024. The CMP17 and CMA4 provisional agendas were also adopted.

‘CMP’ refers to the group of countries that oversees the Kyoto Protocol, an international agreement to reduce greenhouse gas emissions.

India pavilion up

India’s Union environment minister Bhupender Yadav inaugurated the Indian pavilion at COP27. The theme at the Indian pavilion this year is “LiFE – Lifestyle for Environment”, which is India’s call to lead sustainable lifestyles by reducing consumption.

Global State of the Climate’ report

The World Meteorological Organisation launched its provisional ‘Global State of the Climate’ report for 2022. The final report will be published in April 2023.

The report is produced annually and provides a snapshot of the current state of climate worldwide by taking into account important climate indicators, extreme events and their consequences.

Per the report, the last eight years are on track to be the eight warmest on record due to rising greenhouse gas concentrations in the atmosphere. Extreme weather events, including heat waves, droughts and floods, have affected millions and cost billions this year. The rate of sea level rise has doubled since 1993.

On the cards tomorrow

The World Leaders’ Summit, in which heads of states and governments will participate in the Sharm el-Sheikh Climate Implementation Summit, will begin on November 7. It will include the ‘High Level Segment’, where these individuals will also deliver their respective national statements.

Why Antarctica’s Record Warm Weather Is More Than Just About Global Warming

On February 9, a measuring station on Seymour island recorded a temperature of 20.75º C.

On February 9, an island at the northwestern tip of the Antarctic peninsula that juts out towards South America was about as warm as Delhi is at 11 am in the same month. A measuring station on Seymour island recorded a temperature of 20.75º C, breaking the all-time temperature record that had been set just three days previously, recorded by Argentina’s National Meteorological Service at its Esperanza base in Antarctica.

These two temperature records in quick succession sent ripples worldwide, though Carlos Schaefer, a scientist associated with research at Seymour island, clarified that the reading had “no meaning in terms of a climate change trend”. He was implying that, methodologically, we cannot take a single reading and run with it; instead, we needs a series of readings over a reasonably long period to infer a warming trend.

Schaefer and his colleagues are part of a research programme that monitors 23 sites in western Antarctica and, in his words, “We are seeing the warming trend in many of the sites we are monitoring”. In a statement released on February 14, the World Meteorological Organisation said, “The Antarctic Peninsula [where Seymour island is located] is among the fastest warming regions of the planet, almost 3º C over the last 50 years,” compared to less than one degree globally over this period.

Such a trend does make extreme spikes in temperature more possible. However, instead of focusing on a single event, we need to pay attention to the longer processes unfolding in the Antarctic, such as the warming trends, which have actually been mixed; the accelerating loss of ice mass in western Antarctica and why that is happening; and what the drivers underlying these trends are, because they will influence how things unfold over the course of this century and beyond.

Temperature trends in Antarctica

According to the Intergovernmental Panel on Climate Change (IPCC)’s landmark report ‘Oceans and Cryosphere in a Changing Climate‘ (SROCC), released in September 2019, warming over the Antarctic subcontinent has not been uniform, in contrast to the Arctic. Instead, warming has occurred over parts of western Antarctica but not East Antarctica. Additionally, the amplified warming that we have recorded in recent years in the Arctic has not been seen in most parts of Antarctica.

One reason is the increased heat uptake by the Southern Oceans, and illustrates the complex role that oceans play in – largely as of now – reducing surface warming. According to the IPCC’s Fifth Assessment Report of 2013-14, over 90% of the excess heat trapped by greenhouse gases has gone into the oceans. Of this, the southern oceans have taken up over a third since 1970, and over half the heat between 2005 and 2017. Ocean currents around Antarctica also cause a deep mixing of the ocean waters. This means much of the excess heat is being transported into the ocean’s deeper layers, muting surface warming.

According to a note last month by James Hansen and other scientists associated with NASA’s Goddard Institute for Space Studies, another reason for the relatively lower warming of the southern oceans around Antarctica is, ironically, the icy freshwater injected in the upper layers of the ocean due to the increased melting of ice shelves and ice sheets. However, they warned, this results in “an increased heat flux” into the ocean that further melts the ice shelves and speeds up the rate of sea level rise in a positive feedback loop.

Accelerated loss of ice

Much of the accelerating loss of ice mass that these scientists have spotlighted has occurred from the West Antarctic ice sheet and the Antarctic Peninsula. From the combined Antarctic ice sheets taken together as a whole, the ice loss has risen almost fourfold, from 51 billion tonnes a year 25 ago to a stunning 199 billion tonnes a year more recently.

A key reason for the greater loss of ice in recent years has been the accelerating flow of glaciers – also called dynamic thinning – most of it from the Amundsen embayment and the western Antarctic Peninsula. Additionally, 90% of the 860 marine-terminating glaciers on the Antarctic Peninsula have receded over the last few decades.

In turn, the accelerated flow of these glaciers has been influenced by the thinning or collapse of ice shelves around the West Antarctic ice sheet and the peninsula – most spectacularly of the famous Larsen B ice shelf in 2002.

As the the Fifth Assessment Report says, “The collapse of Larsen B, which is unprecedented in the last 10,000 years, resulted in speed up of the tributary glaciers by 300 to 800%.” The Larsen A and Prince Gustav ice shelves also collapsed before Larsen B. All of these, and more, have resulted in a faster flow of glacier ice to the sea, freed from the ice shelves holding them back. And significantly, these ice shelves have been made more vulnerable by warmer ocean waters melting them from below.

Also read: Why India Must Heed the Cracking of a Haryana-Sized Ice Shelf in Antarctica

Complex drivers

Multiple drivers propel the changes occurring in western Antarctica. It would be hasty to assume that anthropogenic warming is the only factor.

Three categories of drivers are responsible for most climatic changes: anthropogenic global warming; other anthropogenic factors not associated with greenhouse gases; and natural variability. For example, relative sea-level rise in the Sunderbans is simultaneously influenced by warmer oceans (the first category), land subsidence due to groundwater extraction (the second) and the Ganga’s ebbs and flows and sandbar formation (the third).

Other than greenhouse gas increases and stratospheric ozone depletion, the Antarctic is influenced by what happens very far away in the oceans, indicative of the complexity of the Earth system in general. “Recent Antarctic peninsula warming and consequent ice shelf collapses,” says the SROCC report, “have evidence of a link to … anthropogenic Atlantic sea surface warming via the Atlantic multi-decadal oscillation.”

Second, unlike most climatic changes being felt around the world, we have not been able to readily identify a significant anthropogenic driver for these changes in Antarctica not linked to greenhouse gases. Perhaps this is due to the fact that the Antarctic treaty system maintains the continent as a scientific preserve and bans any military activity there. It experiences no urbanisation because most of the continent is anyhow not conducive to human settlement of a permanent nature.

As for the third set of drivers – natural variability – they are varied and also include changes in winds over the Amundsen Sea and fluctuations in the ocean currents widely known as the El Niño Southern Oscillation.

§

The IPCC’s SROCC report cautions us that teasing out the relative weight of anthropogenic and natural drivers is as yet difficult. While warming associated with increased greenhouse gases is undoubtedly a factor, atmospheric and ocean variability “in the areas of the greatest [ice] mass change are affected by a complex chain of processes that exhibit considerable natural variability and have multiple interacting links to sea surface conditions in the Pacific and Atlantic” (p. 240).

Having said that, as with the Sunderbans, natural conditions in the Antarctic will wax and wane. However, continued global greenhouse gas emissions of over 50 billion tonnes a year means that the fingerprint of global warming will become unavoidably bigger in future. A paper published in December 2019 indicated that as the planet approaches 2º C of average surface warming, it could amplify winter warming of up to 3º C in the Antarctic. The collapse of massive glaciers such as the Thwaites glacier and others, currently a cause of much concern, could result in sea-level rise of around 10 feet.

Also read: What Does a Water Body Near Antarctica Have to Do With the Monsoons?

So the connection between the recent record temperature in the Antarctic with anthropogenic warming is not methodologically robust – nor is it implausible. Two, there is definite warming in western Antarctica that has accelerated significant ice mass loss and glacier retreat. In what proportion these changes are being driven by anthropogenic global warming or by natural factors is not yet clear. Having said that, global warming will undoubtedly intensify in and around Antarctica, with implications for other species around that continent and of course for us all.

It is therefore encouraging to note that the 11th Indian scientific expedition to the Antarctic waters, with members from 15 research institutions, is currently underway. Its key objective, according to the Ministry of Earth Sciences’ website, is to quantify the changes that are happening and the impacts of these changes on large-scale weather phenomena such as the Indian monsoons. The other obvious long-term consequence of these changes in the Antarctic is sustained sea-level rise due to the melting of the ice sheets, which will impact coastal communities in India and elsewhere for centuries to come.

Nagraj Adve is a member of Teachers Against Climate Crisis. His booklet Global Warming in the Indian Context has been translated into Hindi, Kannada, Tamil and Telugu. He may be reached at nagraj.adve@gmail.com.

Why Climate Change and Bigoted Legislation Are Toxic Bedfellows

Nationalist citizenship laws, such as but not limited to the Citizenship (Amendment) Act 2019, will only make climate change mitigation and adaptation harder than they already are.

In a climate-changed future with higher sea levels, water scarcity, drought and extreme weather events, nature will not discriminate between who is or isn’t Buddhist, Christian, Hindu, Parsi, Shia, Sikh, Sunni or, for that matter, Pastafarian.

Hyper-nationalistic and bigoted legislation, particularly legislation related to citizenship or residence, will impact both climate migrants and internally-displaced climate refugees. Such legislation will be anti-poor, stoke regional tension, spur conflict, harden chauvinistic sub-nationalist stances, severely hamstring economic activity, and will ultimately prove to be ethically and morally untenable. Parts of the world are already witnessing such tragedies.

Political systems have thus far struggled to recognise that climate change will be a major driver of political societies in the future, and recent developments have cast this shortsightedness in short relief. Many contemporary socio-environmental happenings, such as the Pathalgadi movement in India, where tribal people emphasise their constitutional rights of swaraj (i.e. right to self-governance) and their right to environmental emancipation, or the Extinction Rebellion in Europe, where civil disobedience is being used as a tool to take on myopic governments unwilling to recognise the climate crisis, should be interpreted as civic responses to tribalist and morally bankrupt mainstream politics incapable of including even the term ‘climate change’ in their vocabulary, at least in any nuanced fashion.

Three overlapping aspects of climate change triggered these movements, as well as others in countries around the world. The impact of changing climate processes –  water scarcity, sea-level rise, declining agricultural productivity, desertification, etc. – and the increasing frequency of extreme climate events – floods, droughts, forest fires, hurricanes, etc. – as drivers of migration are fairly well understood.

But people, especially policymakers, are only just waking up to the implications of the third factor, non-climate drivers, in the form of government policies that determine community-wise resilience to climate processes and events. Analysts of geopolitical policy have shown how hardlining policies along hyper-nationalistic or linguistic lines can multiply extant threats and push vulnerable states over the brink.

This framework, composed of the three factors, can also be used to analyse how people displaced within countries are likely to be treated as, for example, they move from one state or region to another. Researchers have argued that within large polities in South Asia, the voices of the people most likely to be affected by climate change – i.e. those who live on the margins of society and in resource-poor environments – have been drowned out by development-hungry urbanites. As a result, discussions about climate change, or statements on climate change mitigation and adaptation, rarely feature in election agendas or campaigns of the major political parties in India.

But thanks to climate change, overly strident sub-nationalisms seeking to create interest groups based on religious or linguistic lines are likely to be isolated by barriers of their own making, over time. So the larger implication for internally displaced people is that they will potentially be forced into a situation of statelessness within their own country in the face of a rapidly changing climate and biased legislation.

Communities in South Asia are highly vulnerable to global warming and erratic rainfall patterns. The World Bank has estimated that 800 million people in the region are likely to face diminishing living conditions if the world’s average surface temperature increases by 2.2 ºC by 2050 in a high-emissions scenario that may indeed come to pass, especially given the demand for fossil-fuel energy is likely to increase by as much as 66% by 2040. Sea-level rise alone can potentially endanger the lives of 135 million people in South Asia.

Bigoted legislation governing citizenship and residency, originally conceived by the pursuit of nationalistic or religious goals, can turn even more xenophobic in the context of sub- and inter-national climate migrants. A climate of fear clouds our ethical and moral response to humanity’s potential movement due to climate change. Many countries have resorted to fear-mongering as a tool to push through policies that close their borders and turn hopeful climate immigrants away.

On the other hand, a more humanistic politics firmly rooted in ethical and moral principles will be required to ensure that our world – and the world of our children – does not turn into a toxic wasteland, literally and figuratively.

Bharath Sundaram teaches environmental studies in Krea University, India. The views expressed here are personal.

The World’s Waters Are Rising – but by How Much, and Where?

Countries that are more vulnerable to vagaries of the climate, such as India, also lack the more precise data that could help them plan better.

Earlier this year, climate activists held a funeral for the Okjökull glacier. Its tombstone, the first of its kind, lies on top of a volcano in Iceland, where the ice sheet has been melting at an unprecedented rate. Indeed, if all the ice in Iceland melts, it could raise sea levels around the world about about five feet. And by the end of this century, as more glaciers recede and melt, sea levels could rise by two full metres. That’s about the height of a door.

Recently, Scott Kulp and Benjamin Strauss, two climate scientists from Climate Central, an American nonprofit organisation dedicated to climate research, identified areas that are most vulnerable to projected sea-level rise by 2050 and 2100. They released maps showing parts of Mumbai, Chennai and Kolkata, and other South Asian cities, going under water in the next three decades, suggesting around 300 million people are vulnerable if humankind continues to emit more carbon.

This is about three-times as many people as estimated to be vulnerable in an older model working with the same emission trends.

The significant mismatch arises from how scientists assess land elevation. A more precise prediction requires more precise elevation data. In the early 2000s, scientists obtained the numbers from NASA’s Shuttle Radar Topography Mission (SRTM) to approximate flood risk in coastal areas. “But SRTM data has flaws,” Kulp told The Wire. The technology can’t distinguish trees from buildings and other land features, so the reported average elevation of an area can be vastly different from reality. Errors could run as high as 2 m in low-lying coastal areas.

A more precise way to calculate land elevation is by using light detection and ranging (LIDAR). In a LIDAR-based land survey, scientists attach a laser to a plane, drone or a helicopter and beam light to the ground. The reflected signal indicates how the land rises and falls as the aerial vehicle moves over it. On the flip side, LIDAR is costly and so most Asian countries – whose economies are more vulnerable to vagaries of the climate – don’t have LIDAR data.

Also read: The Struggle to Track Global Sea Level Rise

To work around this, Kulp and Strauss used machine learning. They trained a neural network to identify flaws in SRTM data for the US coast by comparing it with more than 50 million LIDAR data points from the same area. Once the network had ‘learnt’ how SRTM and LIDAR data matched up, they converted SRTM data from around the world into more precise digital elevation data, called coastal DEM, where they estimated the errors were of the order of 10 cm or less.

And when the duo overlaid the sea-level rise model onto the coastal DEM, they found that older models had underestimated flood risk. According to the coastal DEM, they found that without coastal defences, 360 million people would be vulnerable to flooding by 2100 if sea levels continued to rise as the models predict.

Kulp and Strauss also stressed that this would be the case even if all countries stuck to the terms of the Paris Arrangement. If economies don’t cut back on carbon emissions and if the Antarctic ice sheet starts to wear off, 480 million people will become vulnerable to flooding by 2100.

The carbon dioxide that we release into the atmosphere traps heat, driving global warming heating. Historical data shows that global sea levels have been rising more quickly since humankind started burning coal and petroleum as fuels. Between 1900 and 2000, the average sea level rose by about 1.7 mm each year. After 2000, it jumped to about 3 mm/year. Scientists recorded a similar trend for the Indian Ocean – except in the Northern Bay of Bengal, where sea levels rose by 5 mm/year between 1948 and 2010 (as estimated in 2015).

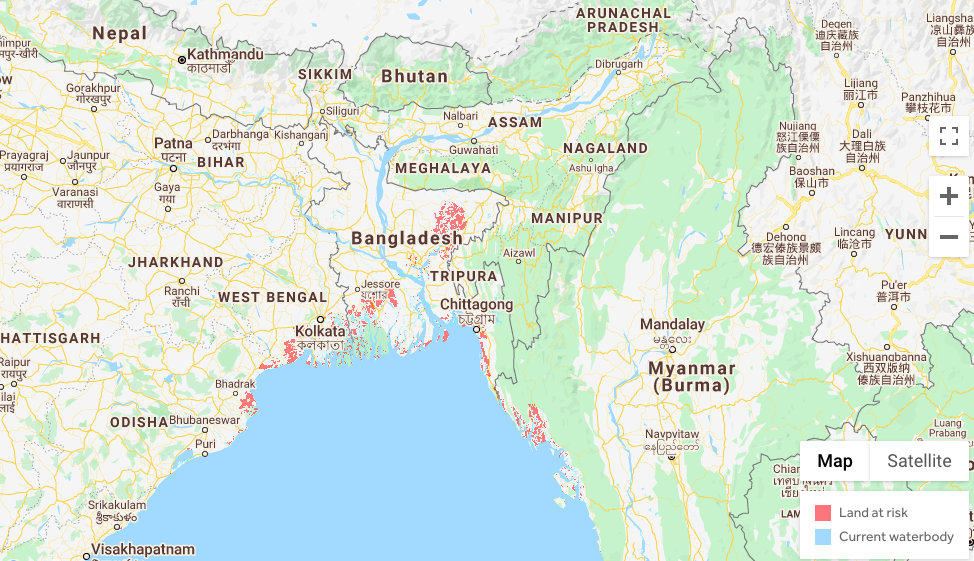
A section of the map showing parts of land at risk in a 'bad luck' scenario by 2050. Map: Climate Central

A section of the map showing parts of land at risk in a ‘bad luck’ scenario by 2050. Map: Climate Central

But the claim that certain neighbourhoods within cities could submerge doesn’t hold water.

According to the maps published along with the duo’s paper, many areas in Mumbai, Kolkata and Chennai could go under by 2100. However, many of these areas also appear to be about 8-10 m above sea level.

Roxy Mathew Koll, a climate scientist at the Indian Institute of Tropical Meteorology, Pune, agrees that the new land elevation estimates are better on a global scale and that there could be uncertainties in the data for Indian cities. “Generally, the uncertainty is above 1 meter, which is larger than the estimates of sea-level rise. But to be certain, India needs a better risk assessment analysis for its coastline,” he said.

Kulp agreed that coastal DEM is more accurate over larger areas than in smaller ones, like cities versus neighbourhoods. He said this is why scientists are talking about flood risk on global and national scales (instead of about the fates of Trombay, Besant Nagar or Siripuram).

These predictions are also limited by the fact that they don’t account for embankments and defence structures that governments have erected to protect the coast from high tide lines. According to the paper, about 110 million people in the world and about 17 million people in India are already living below these lines.

Also read: Bengal’s Diamond Harbour Records Faster Sea-Level Rise Than Other Indian Ports

But Kulp flips the threat on its head to find a silver lining: “Our results give hope that living with high-tide lines is doable” – although if the sea level rises further, more people could be exposed to extreme storms and flooding.

For example, some parts of Mumbai have always been at or below sea level, so a typical worst-case scenario when the sea level is higher would be floods due to extreme rains at high tide. “Such events, called compound events, have the potential to submerge large parts of Mumbai, at least for several days,” Koll said.

And if seawater moves further inland, it can damage soil considered useful for agricultural and even facilitate the spread of disease. In 2015, doctors in Bangladesh were able to associate the spread of cholera with sea-water intrusion. In another analysis published the same year, scientists reported that “suitable areas for Vibrio cholerae” – the bacterium that causes cholera in humans – are “predicted to increase under future climate”, including in coastal parts of eastern India and Latin America.

“Through this study, we want to put pressure on economies and countries to take note of the problem and understand the importance of coastal elevation data,” Kulp said. He, and others, argue such data will help countries assess risk more realistically and plan better for extreme events.

“Another way to look at the study is to realise that cutting back on emissions will help three-times more people,” he added. “And that investing in green technology is three-times more justifiable.”

Sarah Iqbal is a freelance science writer.

What Are Tipping Points?

The idea of tipping points has come to dominate climate science.

This is an edition of Quintessence, a series about fundamental ideas in science.

The pigtailed macaque often get into petty fights. However, if more than five monkeys start a fight, it escalates to an all out brawl. Scientists have observed a similarly abrupt behavioural transition in Anelosimus studiosus, a species of spider. Colonies of these spiders generally coexist peacefully, but when the ambient temperature climbs past 31º C, violence ensues.

In both stories, dramatic changes happen when some parameter crosses a critical threshold. Such thresholds are commonly called tipping points, a term popularised by Malcolm Gladwell’s book of the same name. However, Gladwell defined qualitative tipping points for social contexts whereas the concept was already commonplace in the toolboxes of physicists and mathematicians.

Tipping points show up not just in animal societies but in many ecological scenarios as well. For example, scientists have known of vast patches of land that desertified abruptly due to gradual changes in the environment, or of lakes turning turbid in no time due to changes in their nutrient uptake. These are complex systems responding to numerous environmental and societal cues. Keeping track of all these cues and the responses they elicit is often impossible, so scientists have turned to techniques that can simplify these interactions.

One way is to transform these physical systems into a collection of mathematical equations. Different terms in these equations account for different details. Scientists call this approach reduced order modelling. Apart from making notoriously difficult problems open to analysis, this method allows researchers to invoke nonlinear dynamics, a branch of physics and mathematics.

Quintessence

Scientists use nonlinear dynamics to track how a system responds when it is prodded by an external disturbance. If a swinging pendulum is jolted slightly off course, physicists have a set of equations informed by the principles of nonlinear dynamics to calculate its new path.

When tipping points began to appear in ecology, biology, etc., scientists began to appeal to work mathematicians had already done to study similarly abrupt transitions. Specifically, the scientists were curious if they could use these techniques, together with reduced order modelling, to help them make sense of why some systems tip over from one state to another.

Let us reduce the behaviour of a colony of heat-stressed Anelosimus studiosus spiders into a set of equations and process them with nonlinear dynamics. The process spits out a three-dimensional graph that looks like it has mountains and valleys.

This graph is the landscape. Each feature on the landscape stands in for a state of the system. In our example, these states are ‘cooperative’ and ‘aggressive’. The system is said to be stable if it is at the bottom of a valley: like a ball dropped there, it can’t climb out of the valley to a new state unless it is supplied the energy to do so. However, a system at the top of a mountain is very unstable: like a ball, it can roll down in one of any number of directions at the slightest touch.

So say we start out at 21º C, and the system is in a stable ‘cooperative’ valley, separated from the ‘aggressive’ state valley by a small mound. There are two ways for the system to go from one valley to the other: either the external disturbances are strong enough to get the system over the mound or something makes the mound itself go away.

When scientists increased the temperature, they found the mound became smaller and smaller until, at just below 31º C, the two states were separated by flat land. This is the tipping point. Any further erosion could cause the ‘cooperative’ state to be higher than the ‘aggressive’ state, and the system would roll down to its macabre destiny.

Using the visuals of mountains and valleys, and a ball rolling across them, also throws up other interesting insights into the idea of tipping points.

For example, as long as the mound stood (to whatever height), the system lazed in the stable valley, oblivious to the perils on the other side. But when the mound disappeared, the system was suddenly faced with a drastic transition.

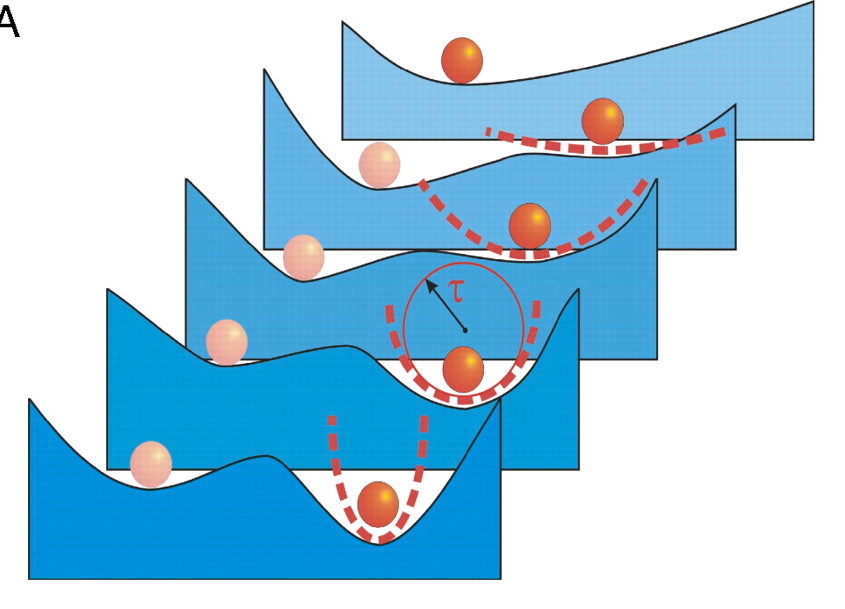
For another, even if the mound hadn’t been flattened all the way and remained as a small lump on the landscape, it could cause the valley behind it – the ‘cooperative’ valley – to become shallower (see image below). A system at the bottom of a shallower valley takes longer to settle down after a nudge than a system in a deeper one, just like a ball might spend longer to come to rest at the bottom of a bowl than it would in a drum.

A schematic showing how the stability landscape changes when the mound between two valleys is eroded. The time of recovery from perturbation becomes longer as the valley becomes flatter. Image: 10.1073/pnas.0705414105

A schematic showing how the stability landscape changes when the mound between two valleys is eroded. The time of recovery from perturbation becomes longer as the valley becomes flatter. Image: 10.1073/pnas.0705414105

This behaviour is a giveaway that the system is ‘dissatisfied’ with its current state and is probably going to tip into another one. Researchers use it to identify systems moving towards tipping points, like bacterial communities at the cusp of extinction or, as it happens, our planet itself.

One of the most complex systems we know of is Earth’s climate. It is a mostly intractable beast of many moving parts interacting in ways we don’t fully understand. Climatologists have identified many potential tipping points in this system, most of which have to do with the natural processes, or engines, that drive heat and water circulation. Even if only one of these engines fails, the system could change catastrophically.

The climate also has many positive feedback loops – processes that, when disturbed, amplify the disturbance. For example, ice reflects heat, so when global heating melts ice, less heat is sent back to space and more lingers on Earth’s surface. This in turn causes even more ice to melt. This way, these loops can reinforce otherwise innocuous perturbations and cause a system to tip over to a new state.

So Earth has two paths in front of it: either its environment gets bad because we have disturbed it so much and positive feedback loops make it worse – or climate change alters the planet’s stability landscape and creates tipping points that, in turn, bring on catastrophic changes. Both paths lead to new states, and both states promise to be hellscapes.

Also read: What Is Quantum Biology?

In fact, the idea of tipping points has come to dominate climate science. The term is often used in a more general sense to invoke a sense of immediacy, even if how close we are to bypassing one or more such points is the subject of furious debate. This is primarily because it is so difficult to obtain quantitative measurements of the climate’s stability and resilience. Even the best climate models struggle to predict and capture abrupt changes.

If someone asks you if we are actually near any tipping points or if we have we already crossed one, the correct answer is that we don’t know for sure. What we do know is that humans have radically changed the stability landscape of Earth’s climate, making it more cryptic and potentially even causing a runoff calamity.

In this time, history won’t guide us because there have been no precedents for such change. That said, prevailing wisdom suggests that we should be able to guide Earth away from this dangerous path by building an alternate one. In other words, we need to resculpt the stability landscape. It would no doubt require a global collaboration of the kind we haven’t had before, but today is all about doing things for the first time.

Note: The article originally stated that Anelosimus studiosus spiders become cannibalistic when the ambient temperature crosses 31º C. They don’t; they become more violent. The mistake was corrected at 11:54 am on August 7, 2019.

Ronak Gupta is doing a PhD in fluid mechanics at the University of British Columbia, Vancouver.

Greenland Experiences Unprecedented Levels of Ice Melt

During this week alone, around 50 billion tonnes of ice is expected to melt on the island, contributing to a measurable increase in global sea levels.

New Delhi: Days after several countries in Europe weathered their highest temperatures in recorded history, Greenland has been gripped by the same heat wave. The country’s ice sheets are melting at an unprecedented rate, contributing to a permanent rise in Earth’s ocean levels.

On Thursday, climate scientists reported that 12 billion tonnes of Greenland’s ice melted. This week alone, 50 billion tonnes of the country’s ice sheet is expected to melt. This would be enough to permanently increase the world’s sea levels by 0.1 mm, while the melt from the ice sheets in July contributed to a rise of half a millimetre in global sea levels.

While these measurements may not seem alarming if seen in isolation, scientists warn that such events are becoming increasingly common. The cumulative effect of Greenland’s ice melt – the single largest contributor to sea level rise – will prove disastrous to coastal communities over the next few decades.

Also Read: Bengal’s Diamond Harbour Records Faster Sea-Level Rise Than Other Indian Ports

Meteorologist Eric Holthaus told CNBC, “The fact that we are getting measurable sea level rise out of a single day of melt is shocking.” He said the “real and lasting consequences” from this single heat wave will last for “thousands of years”.

In natural course, the ice melted during the summer is gained through snowfall in the winter. However, climate change and rising global temperatures have disrupted this cycle, ensuring that the loss is higher than the gain.

After the heat wave set in, Greenland’s temperatures have been 3.8º to 1.1º C warmer than normal. One journalist reported that on Thursday, the temperature was 22º C (71.6º F). Even in its warmest months, Greenland’s temperatures rarely exceed 10º C.

The only comparable event in recorded history is the melt of 2012, when for a few days, 97% of Greenland’s ice sheets experienced melting. The current heat wave is likely to surpass the 2012 melt. Jason Box, an ice climatologist, said the current melt is 1.2 times that of the 2012 event.

The Danish Meteorological Institute, Greenland’s official weather service, said almost all the ice sheets is experiencing melt.

Holthaus wrote in Rolling Stone that the current melting scenario hints that the UN Intergovernmental Panel on Climate Change (IPCC) may have to revise its projections of temperature rise. The amount of ice lost by Greenland in July – 160 billion tonnes – is what the IPCC projected a typical summer in 2050 would cause under a worst-case warming scenario. Reality was off by three whole decades.

Xavier Fettweis, a polar scientist who tracks meltwater on the Greenland ice sheet, told Holthaus that the increased frequency of melt events means the IPCC scenarios “clearly underestimate what we currently observe over the Greenland ice sheet”. He said the organisation should revise their projections.

In the 1980s, scientists similarly underestimated the effects of climate change as Greenland’s summer melt was balanced by winter snow. Scientists estimated that it would take “thousands of years” for the ice to completely melt because of global warming.

Also Read: How Can You Tell When a Glacier Is Dead?

Recent studies show that the country passed a ‘tipping point’ in 2003. Between 2003 and 2012, the rate of melting quadrupled. Worse, the accelerated melt came from southwest Greenland, an area not known to be losing ice rapidly.

In its highest elevation regions, Greenland’s ice sheet is 10,000 feet thick. The country’s ice sheet extends about 1.7 million square kilometres, covering almost the entire island. If the sheet melts completely, global sea level would rise about 20 feet.

An Indian summer in the Arctic

Greenland, and the Arctic region are experiencing some of their hottest months. Unusual wildfires have been raging in several ice-capped regions of Alaska, Canada, Russia, and even Greenland. Again, though wildfires triggered by lightening are observed in the region, their frequency is accelerating.

Arctic wildfires over Alaska and Canada observed by NASA. Photo: NASA

Wildfires are causing the release of large amounts of carbon dioxide. Between June 1 and July 21, the wildfires are estimated to have released roughly 100 mega-tonnes of carbon dioxide into the atmosphere, according to the Copernicus Atmosphere Monitoring Service. This is roughly Belgium’s total carbon output for 2017.

These fires, seen in harmony with the Arctic sea ice receding, will have alarming effects on the Earth’s ecosystem. As of July 15, Arctic sea ice extent was 1.91 million sq. km below the 1981-2010 average.

The Himalayan situation

The Hindu Kush Himalayan (HKH) ranges are also warming, with 15% of its glaciers already disappearing. Recent reports suggest that even a best-case scenario cut in global emissions could melt at least a third of the glaciers by 2100. As The Wire had reported in February, this could put the lives and livelihoods of 1.65 billion people living in downstream river basins of the ranges at threat.

Also Read: Two Thirds of Glaciers in the Hindu Kush Himalaya Could Melt by 2100

If emissions are not cut and warming trajectories continue at current levels, two-thirds of all glaciers in the HKH would disappear by the end of the century. As The Wire reported, though the region’s per capita carbon dioxide emission is just one-sixth of the global average, “it will have to bear significantly higher impacts”.

Ranging from Aghanistan to Myanmar, the HKH covers over 3,500 kilometres and is home to 250 million people. Around 1.65 billion people rely on the rivers that originate in the HKH ranges, often called the world’s ‘third pole’ because they hold the most ice outside of the Antarctic and Arctic regions.

Bengal’s Diamond Harbour Records Faster Sea-Level Rise Than Other Indian Ports

The Centre said the sea level at the Bengal port rose at 5.16 mm per year – compared to a national average of 1.3 mm per year in the last 40-50 years.

New Delhi: The Ministry of Earth Sciences has said in the Lok Sabha that of the big ports in India, Diamond Harbour in West Bengal has witnessed the largest rise in sea levels. Between 1948 and 2004, the ministry said, the sea level at Diamond Harbour rose at 5.16 mm per year – compared to a national average of 1.3 mm per year in the last 40-50 years.

According to the International Panel on Climate Change, sea levels have been rising at an average rate of 1.8 mm per year across the world over the last century, The Hindu reported.

While Diamond Harbour may be showing the fastest increase, its not the only Indian port where sea levels are rising faster than the global average. Kandla in Gujarat (3.18 mm per year), Haldia in West Bengal (2.89 mm per year) and Port Blair in the Andamans (2.2 mm per year) also make it to that list.

“Rising sea levels can exacerbate the impacts of coastal hazards such as storm surge, tsunami, coastal floods, high waves and coastal erosion in the low lying coastal areas in addition to causing gradual loss of coastal land to sea,” the ministry said in its response to MPs Saugata Roy and Anto Antony.

What’s going on?

The short answer: Climate change.

That sea levels are rising – and rising fast – along the Bengal coast should not come as a surprise. In December 2017, Nagaraj Adve wrote in The Wire about a school building in the Sunderbans that was destroyed because more and more water came in. And it’s not just a school – houses and fields too had to be relocated.

Why are sea levels rising? Specifically, here’s what is happening: gigantic ice sheets on Antarctica and Greenland are melting.

Also read: The Centre’s Exclusionist View of Conservation Is Increasingly Counterproductive

What’s worse is while scientists have said that this will continue to happen and accelerate sea level rises, it’s hard for them to predict just how fast things are changing. As Reuters’ journalists Lucas Jackson and Elizabeth Culliford wrote, “The best predictions for sea-level rise this century are getting more dire, and yet less precise, in part because of a lack of understanding of these glaciers [of Greenland and Antarctica] and how their behaviour fits into global climate modelling.”

A major reason why these predictions are so difficult is because it involves dangerous research – to the extent that scientists are forced to rely on tagging sensors on local wildlife to record depth, temperature and salinity year-round.

What is being done?

The short answer: Definitely not enough.

While we may not be able to predict just how fast things will change in the future, we do know that things are already changing. The short-term demand in Indian coastal areas – such as the from people Adve spoke to in the Sunderbans – is for an embankment that can stop the water from damaging their property. But what about in the longer term?

Neither state governments nor the Centre have a serious plan on how to manage India’s coastal areas in light of the rising sea levels. Nikhil Anand’s article in The Wire details how let alone past projects – the government does not even seem to be taking into account how its future projects will cope with a changing coastal environment.

Also read: Low-Income Neighbourhoods Are More Vulnerable to Heatwave Spells

Take the case of Mumbai’s Coastal Road Project, stretching from Marine Drive to Worli. Anand argues that the development may exacerbate urban flooding with heavier rains and the displaced, rising sea – but the government has not carried out any proper studies on this before embarking on construction. He writes:

“By radically altering the city’s coastline through reclamation and infrastructure construction without even so much as examining and addressing the impacts of this project on an intensification of urban flooding in the future, it is actively being engaged in the long-term production of a “natural” disaster.”

What needs to be done?

The short answer: More research and better planning.

In this case, the long answer and the short answer aren’t that different from each other. Governments, at the state and Central level, must stop going on as if they don’t know that the environment is changing, several researchers have argued. As Adve wrote:

“We…need a long-term plan to regenerate mangroves, not destroy them, to break the force of advancing waters or cushion us during storm surges. We need to treasure our wetlands, not build over them as is happening with Ennore Creek in Chennai and innumerable other wetlands along India’s coasts. We need to pay heed to the lessons Boatkhali Kadambini Primary School [in the Sunderbans] is teaching us, not slide into climate chaos with our eyes tightly shut.”

They Helped the Forest Grow. But in the Face of Climate Change, They’re Helpless.

The Pichavaram mangrove forest near Chidambaram, Cuddalore, is the world’s second largest of its kind. And 150 Irula families helped nurture it in the 1980s and 1990s.

Pichavaram, Tamil Nadu: Sitting on the floor of her dingy hutment, Sengi Amma fixes her fishing net, recalling the time every trip to the Pichavaram estuary used to fetch her 10 baskets of fishes. Back then, each basket – about 15 kg – would sell for Rs 200.

“In the last 15 years or so, fish catch has declined drastically, and now I barely get one basket a trip,” she said.

The drop in catch has directly hit the livelihoods of 150 Irula families in MGR Nagar, a small settlement near Pichavaram in Cuddalore, Tamil Nadu.

The Irula are a scheduled tribe. “We own no farmland and our fathers and forefathers used to work like bonded labourers,” said Mari Muthu, a 40-year-old resident of MGR Nagar. “Our traditional occupation was catching snakes and rats. Our community has also been stigmatised as vaider [poachers].”

Over the last few decades, they have tried their hands at different jobs. But despite their efforts, Muthu thinks they’re eventually going to become climate refugees.

He’s referring to shifting rainfall patterns and sea-level rise, both of which are affecting the estuary and its fish over the last two decades. “The estuary isn’t getting enough fresh water and sea-water,” Muthu said. “After the 2004 tsunami, the mouth of the estuary has faced sedimentation,” as a result of which the fish aren’t able to move from the sea into the estuary.

In fact, climate change isn’t affecting just the Irula families in MGR Nagar. “There are 591 fishing villages along Tamil Nadu’s coastal areas and all of them are facing challenges due to changes in the coastline,” said T Asai Thambi, a team leader with the coastal conservation and livelihood programme of the DHAN Foundation, Madurai. He added that the warming waters have also adversely affected the sizes and populations of fish, and that many of them have “migrated to other areas”.

A. Ramachandran, an emeritus professor at the Centre for Climate Change and Adaptation Research, Anna University, recently concluded a study of how climate change will affect Tamil Nadu specifically. He cautioned that the northeast monsoon, which kicks in between October and December, will be particularly bad for fishers, including the Irula.

“Sea-level rise poses a serious threat to the fishing villages in the state, many of whom will be engulfed by the sea, and force fishers to become climate refugees,” Ramachandran said at a workshop on climate justice in the Bay of Bengal region in November.

Sea-level rise projections – from 4.51 cm to 4.94 cm – along Tamil Nadu's coastal districts by 2025. Source: A. Ramachandran

Sea-level rise projections – from 4.51 cm to 4.94 cm – along Tamil Nadu’s coastal districts by 2025. Source: A. Ramachandran

A symbiosis

The Irula are one of six primitive tribal groups that Tamil Nadu’s northern northern districts. They are known for their knowledge and use of herbal medicines, tracking and digging skills, and have been dubbed “the last forest scientists of the world”.

Members of this tribe are adept at catching snakes by tradition. They played an important role in helping export large amounts of snake skin during the 1950s and 1960s. However, trade in this organ was banned after the Wildlife (Protection) Act kicked in in 1972. Herpetologists have noted that this left the Irula unable to feed themselves.

“Most members of our tribe were illiterate and mistreated. After the ban on snake-hunting, our fathers started working as bonded labourers for landlords,” said Kuppamma, a resident of MGR Nagar. “We were leading a cursed life as we had no land and no livelihood.”

Before moving to MGR Nagar in the mid-1970s, the Irula families lived in nearby Panandopu village under the constant threat of eviction.

“In the 1970s, M.G.Ramachandran visited our area for a film shoot and saw our plight. He helped us get land titles and settled us in this area,” according to Kuppamma. And that’s why it’s called MGR Nagar.

However, they still had no sources of income.

“We started fishing in the Pichavaram mangrove forest estuary. Since we were too poor to afford fishing nets, we would fish with our bare hands, by building small mud check-dams to catch the fish,” according to Muthu. However, the forest department soon banned these dams for fishing because that affected the movement of water within the mangrove forest.

The Pichavaram mangrove forest near Chidambaram, Cuddalore, is the world’s second largest of its kind. It is spread over 1,350 hectares between two estuaries the Vellar in the north and the Kollidam in the south.

A 2010 report by the M.S. Swaminathan Research Foundation (MSSRF), Chennai, states that every year, “about 245 tonnes of fishery produce is harvested from this mangrove wetland, of which prawns alone constitute 208 tons (85%) of the catch.”

An environment ministry estimate holds that 1,900 fishers and 800-900 cattle grazers depend on the mangrove wetland for their livelihood. The wetland forest itself is home to over 13 species of mangroves.

A map of the Pichavaram mangrove forest between the Vellar and Kollidam estuaries. Credit: MoEFCC

A map of the Pichavaram mangrove forest between the Vellar and Kollidam estuaries. Credit: MoEFCC

To support the Irula families in MGR Nagar and other neighbouring hamlets, the forest department offered them work: to dig channels inside the Pichavaram mangrove forest to help spread water inside the estuary and help the mangroves grow.

Sengi Amma, another Irula resident in the area, said that they were paid Rs 60 for every 10 metres of channel dug about 30 years ago, in the late 1980s. “Then, in the early 1990s,” the MSSRF “approached us to restore the Pichavaram mangrove forest by planting mangroves. We were offered Rs 120 for every 10 metres of channel dug and mangrove restoration work carried out. That became our new source of livelihood,” she said.

“Between 1990 and 1993, we restored 10 hectare of mangrove forest in Pichavaram with the support of local villagers, including the Irula of MGR Nagar. The forest department was involved, too,” said R. Ramasubramaniam, the principal scientist at MSSRF’s coastal systems research programme.

Restoring a mangrove meant connecting a degenerated area to a natural canal nearby through a long and deep artificial canal. Multiple feeder canals were dug to cover the entire degraded area.

This network of grooves allowed tidal water to freely flow in and out of the degraded area, thus decreasing its salinity and improving soil moisture. Thereafter, mangrove seedlings were planted.

Muthu said they realised how important the forest was after the 2004 tsunami. “Seven villagers in MGR Nagar died in the tsunami, but our losses were very little compared to the widespread destruction around us because the mangroves had acted as a natural shield.”


Between 1992 and 2005, mangrove plantations covered over 400 ha of land in Pichavaram. Of this, the MSSRF had set up 100 ha and the forest department the rest. And all of it happened with the help of the local communities, Ramasubramaniam said. The forest department formalised this relationship in 1997 and introduced a ‘joint forest management plan’ in Pichavaram.

“The villagers were trained to dig canals, plant mangroves and carry out desilting work. Now they operate boats inside the mangrove forest during tourist season and earn a living. Fishing is also allowed,” according to G. Muthukumaran, who has been working with the forest department at Pichavaram for the last 20 years.

The estuaries of the Vellar and Kollidam rivers, which form part of the Pichavaram wetland forest, are ideal breeding grounds for fish. “There are several fishes that lay eggs in the sea, and the larvae come to the estuary because the estuary is less salty and has more food available,” Ramasubramaniam explained.

However, climate change is fast changing the face of the mangrove forest, which has a direct bearing on the coastal communities. “The estuary is not receiving enough freshwater and we fear that in the coming years, some species of mangroves may disappear from Pichavaram. This will also affect fishes in the estuary,” Ramasubramaniam said.

Muthukumaran is worried for the same reason. “The estuary is not receiving freshwater, and for the last two years, we have had little rainfall.”

Temperature and rainfall projections in Tamil Nadu, by 2100. Source: A. Ramachandran et al, 2016

Temperature and rainfall projections in Tamil Nadu, by 2100. Source: A. Ramachandran et al, 2016

In a 2016 study, Ramachandran and his colleagues at Anna University drew up regional climate-change projections for Tamil Nadu. They expect an average temperature rise of 3.1º C and an annual rainfall decline of 4% by 2100 – all drastic numbers.

Sengi Amma doesn’t know where the Irulas familiar can go or what they can do next. “The mangrove restoration work is over and now the forest department needs labour for desilting. It pays a daily wage of Rs 300 to men and Rs 200 to women – but we want it raised,” she said.

To make ends meet, the residents of MGR Nagar have also taken up odd jobs for daily wages. “We cannot survive on fishing alone,” Kuppamma said.

The Irulas aren’t alone – but that’s not any solace. In 2015, scientists at the Central Marine Fisheries Research Institute, Chennai, collected data on indigenous technical knowledge from 200 fishers in and around the city. In their paper, they reported that most fishers believed the effects of climate change seemed to be more pronounced after the tsunami, especially since about 2010.

However, their blame was pointed squarely at overfishing, juvenile exploitation and habitat destruction.

Nidhi Jamwal is an independent journalist based in Mumbai.

A Continent’s Fate at Risk Should the Antarctic Treaty Become Modifiable

As it stands, the Antarctic Treaty acts as a safeguard for Antarctic science: an international bulwark against commercial or political interference. But as the years tick by, the treaty – and the cooperation that accompanies it – could begin to quietly fracture or even disintegrate completely.

Three decades from now, several crucial elements of the Antarctic Treaty will come up for possible renewal, plunging the future of the continent into uncertainty.

For six decades, the treaty has been the cornerstone of governance for our most southerly, harshest and most pristine continent. It has fostered scientific research, promoted international cooperation, ensured non-militarisation, suspended territorial claims and strengthened environmental protections. Its guardians are the Antarctic Treaty Consultative Parties (ATCPs) – chief among them the US, UK, Australia, New Zealand, Russia, Norway, Germany, Chile and Argentina.

Out in the field, a new generation of robots and drones are peering under ice shelves, probing the ocean depths and monitoring glaciers, ushering in the age of the “Smart Antarctic”. The ice sheets aren’t exactly flourishing – the Antarctic continent has lost three trillion tonnes of the stuff since 1992 – but scientific research is thriving.

For many polar researchers this is a reason for optimism – but in the political arena, the horizon is darkening. As it stands, the Antarctic Treaty acts as a safeguard for Antarctic science: an international bulwark against commercial or political interference. But as the years tick by, the treaty – and the cooperation that accompanies it – could begin to quietly fracture or even disintegrate completely.

Riches under the ice

In 1998, seven years after it was first signed into the treaty, the Protocol on Environmental Protection came into effect. Its purpose was to “enhance protection of the Antarctic environment and dependent and associated ecosystems” – a noble if poorly defined pledge that has proven difficult to uphold. But, tucked away among the acronyms and technical terminology, Article Seven of the Protocol consisted of a single important sentence, easily missed by the careless reader: “any activity relating to mineral resources, other than scientific research, shall be prohibited”. Simple and to the point. Antarctica’s natural resources, whatever they may be, are to remain pristine and untouched. At least for now.

Article 25 carries a caveat: “If, after the expiration of 50 years”, it reads “any of the Antarctic Treaty Consultative Parties so requests, a conference shall be held as soon as practicable to review the operation of this Protocol”. In other words, 30 years from now in 2048, the ATCPs could reject anti-mining regulation and start stripping Antarctica of its mineral resources, diverting the continent towards a radically different future.

Many consider this undesirable, unworkable and unthinkable, but long-time observers know that the uncharted waters of polar politics can constantly surprise.

A changing climate

In fact, the “unthinkable” has already been thought – and half-acted upon. In the 1980s, the ATCPs drew up an international mining framework called the Convention on the Regulation of Antarctic Resource Activities, which sought to regulate any possible future resource extraction. It established property rights and gave special privileges to seven claimant states – including the UK. The framework would not function today – China and India would certainly demand far-reaching revisions – but in the 1980s it was only when France and Australia pulled out and started championing the current protocols that the convention was shelved.

Indeed, a number of states might now have issues with the treaty. Much of the governance set down by the Antarctic Treaty still dates from when it was first negotiated in the late 1950s, in a very different political, technological, legal and environmental climate. It only involved 12 states and was concluded long before China became a polar superpower. The Antarctic ice sheets were considered stable – and there was still a great deal of mystery surrounding what lay beneath them. There was little to no tourism – now it’s the biggest industry operating in Antarctica.

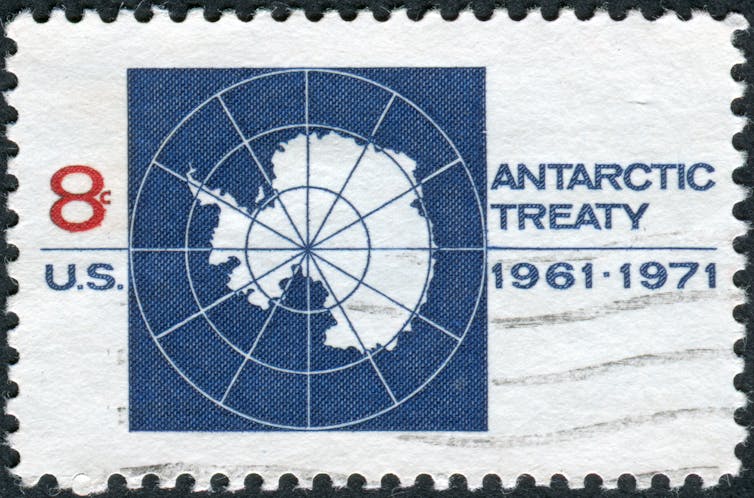
The first Antarctic Treaty featured 12 countries, and came into effect in 1961. Credit: Wikimedia

Fast forward to 2048: the Antarctic is melting, plastics are found in the ice, and foreign species (including yet more humans) dot the continent. Drones and other automated vehicles are routinely used and the polar summer is a hive of activity, with thousands of tourists mobbing every penguin colony. Commercial fishing thrives in the Southern Ocean and permanent settlements spring up on the Antarctic peninsula and surrounding islands. The profits available from biological harvesting have made the extremes of Antarctic living a reality.

Indeed, major polar operators such as China and the US only continue to support the mining ban because their energy needs can be satisfied elsewhere. At present ACTPs are focusing on improving cold weather technology and gaining confidence in Antarctic conditions, but it might not be long until they have the capability and incentive to do more. China is already using underwater vehicles to search for gas hydrates and metallic nodules in the South China Sea. Ominously, underwater mining and deep-sea energy prospecting seem set to be growth industries over the coming decades.

A contested continent

So what could change between now and 2048? Possibly little: the ATCPs might decide to keep the Protocol and continue to prohibit mining. Or they might not.

The recent announcement of a marine protected area in the Ross Sea was a good sign for conservationists, but it required a great deal of tough negotiation. This “general protection zone” forbids fishing completely, and joins an existing “special research zone”, which permits limited fishing of for toothfish and krill. These will come up for review in 2047 and 2052, adding another dimension to what could become a period of unparalleled change for polar governance.

If the ATCPs decide to question the provisions of the Protocol, automated mining could begin soon after. Those in favour might argue that the Antarctic environment is continuing to degrade in a way that no amount of regional management can halt. Or they might put forward the view that the need for new sources of protein outweighs the “restrictive” conservation measures. Either way, the “special” qualities of Antarctica might not carry quite the same emotive weight in the future.

The ConversationAfter 2048, Antarctica could be carved up between nations like every other land mass and surrounding ocean, and slowly relieved of its resources. Those who care about the future of Antarctica must keep a close eye on the continent and its surrounding seas, or risk losing them to drones, drills and desperate politicians.

Klaus Dodds, Professor of Geopolitics, Royal Holloway

This article was originally published on The Conversation. Read the original article.

Why We Suspect Earth’s Journey Around the Sun Had a Say in How Life Evolved

It all began with a big debate: were the great extinctions and population explosions on Earth history driven by innate biological activities or were they prompted by environmental factors on the outside?

At various points in Earth’s history, life has been wiped out in cataclysmic extinction events and, at other times, life has evolved at a blistering pace thanks to a surplus of certain resources. According to a new study, one force that could have affected the coming and going of these biological flashpoints is – wait for it…

Changes in the way Earth moved around the Sun.

You read that right.

Scientists are still debating whether the great extinctions and (population) explosions were driven by innate biological activities or were prompted by environmental factors on the outside. One popular theory tries to broker a ceasefire: that while predators and competition affected species locally over smaller time scales, climate and tectonic events shaped life regionally over larger periods.

“We are interested in the general problem of what controls biodiversity,” James Crampton, lead author of the new study, told The Wire. “Is there a fixed limit on the number of species living at any time, or could this number just keep on increasing?” He’s a professor of palaeontology at the Victoria University of Wellington, New Zealand.

To answer these questions, we need to find out which force has the bigger effect: the internal biologicals or the external environmentals.

Now, apart from natural and anthropogenic influences, cosmic changes also affect Earth’s climate over several hundred thousand years. The planet’s path in its journey around the star isn’t fixed; it changes once over the course of a few to many lakh years. These changes are collectively called Milankovitch cycles, named for the Serbian geophysicist Milutin Milanković.

Each cycle accounts for three changes in Earth’s orbit: eccentricity, obliquity and precession. Eccentricity is how much the elliptical path around the Sun deviates from a perfect circle. Its value changes between every 100,000 and 413,000 years. Obliquity is how much the Earth’s rotation axis is tilted from the normal, which ranges from 22.1° to 24.5°, and cycles about every 41,000 years. Precession is the wobble of Earth’s axis; this movement has a periodicity of 19,000 to 23,000 years.

Apart from these three cycles, there have been ‘grand’ cycles every 2.4 million years for eccentricity and every 1.2 million year for the obliquity. These grand cycles have been already correlated with glacial cycles and sea-level changes on Earth.

And all together, they affect how much sunlight reaches Earth’s surface, thus altering the climate.

Crampton and his colleagues think the influence might extend further to terrestrial life as well. “However, this has never been demonstrated except in geologically recent mammal fossils in the last few million years,” he said. “So we set out to test this in our data.”

They looked at species diversity and extinction patterns in a group of now-extinct marine organisms called graptoloids. Hundreds of millions of years ago, these plankton-like creatures floated around in colonies, eating bacteria and single-celled algae. Although they have been extinct for a long time, there are very good fossil records of thousands of graptoloid species preserved around the world.

The researchers had previously recorded information about when each species of graptoloid evolved and when it went extinct, put together over a decade by two of the authors, Roger Cooper and Peter Sadler. Using this information, the new study examined about 1,800 species over 60 million years, between 480 and 420 million years ago, when the species diversity was highest. This span also includes the Great Ordovician Biodiversification Event, one of the most significant increases in the number of species Earth has ever seen.

From the data, they extracted rhythms in the rates of evolution and extinction and compared them to pulses in the Milankovitch cycles.

Both speciation and extinction – together called species turnover – displayed a 2.6-million-year pulse, close to the 2.4-million-year grand cycle for eccentricity. There was also a weak pulse every 1.3 million years, but which was stronger in the early part of period the researchers analysed. This correlated with the 1.2-million-year grand cycle for obliquity.

Together, 9-16% of species turnover in the 60-million-year span could be explained by the two grand cycles, suggesting a significant influence of external factors on how life changed on Earth.

Richard Bambach, a palaeontologist at the Smithsonian National Museum of Natural History, Washington DC, who studies how species diversity changes over time, said the study was “very well put together” and its conclusions, “unusually strong”.

An older study had unearthed extinction cycles among some ancient organisms, albeit with much larger periods of about 27 million and 62 million years, possibly caused by asteroids and other cosmic agents.

“Sedimentologists have suggested that several patterns in the formation of some types of sedimentary rocks may also reflect ancient Milankovitch cyclicity, but then haven’t had the precise dating system graptolites provide to establish such conclusions so certainly,” Bambach said.

The processed species turnover data also has a bonus for astronomers. Today, stargazers can study variations in Earth’s orbit back to about 50 million years. But the fossil data allows them to infer details of Milankovitch grand cycles up to about 480 million years ago.

However, this assumes that the Milankovitch cycles had the same modern timing about 450 million years ago, which may or may not be true, Bambach said.

For David Bapst, an analytical palaeobiologist at the Texas A&M University, College Station, the study raises more questions about which forces are important in driving species diversity. He pointed to another study published earlier this year using the graptoloid dataset, which suggested that about 12% of the change in species diversity arose from how many graptoloid species were present at the time. In other words, diversity increased slowly if variation in global species was higher.

“Given that they find in this new paper that the cyclicity is only responsible for 9-16% of the variation they see in the graptoloid diversification, I’m just left wondering which component is most important, and how accounting for the effect of one impacts the other,” Bapst said.

According to Crampton, this is only one more piece in the puzzle of life on Earth. “But there are still so many things about the richness of life that we don’t understand.”

One question his team is trying to answer is how fast ecosystems recover after major extinction events. The answer is  obviously important for today: some studies say we’re already in the middle of a sixth mass extinction. “Our data can help with this question and this is something that we will be working on,” Crampton said.

Lakshmi Supriya is a freelance science writer based in Bengaluru.