A massive container ship remains wedged in the Suez Canal, blocking a crucial global trade artery for a third consecutive day. The 224,000 ton Ever Given measures 400 meters, nearly as long as the Empire State building is tall. The Suez Canal Authority stated that the vessel ran aground during a dust storm with low visibility and freeing it could prove a complex process with the potential to take days. The incident has already caused major tailbacks at both ends of the canal with at least 150 vessels, mainly container ships and oil tankers, dropping anchor.
The Suez Canal serves as a crucial passageway and it allows ships to avoid the much longer route around the Cape of Good Hope on the southern tip of Africa. With just over 50 ships passing through it per day on average, delays are likely to have repercussions ranging from higher shipping contracts and oil prices to lawsuits over late cargo. If the situation is not resolved swiftly, the impact on oil prices could be significant given that around 10% of seaborne oil transits the Suez Canal. By some estimates, around 10 million barrels of oil are now backed up at both ends of it.
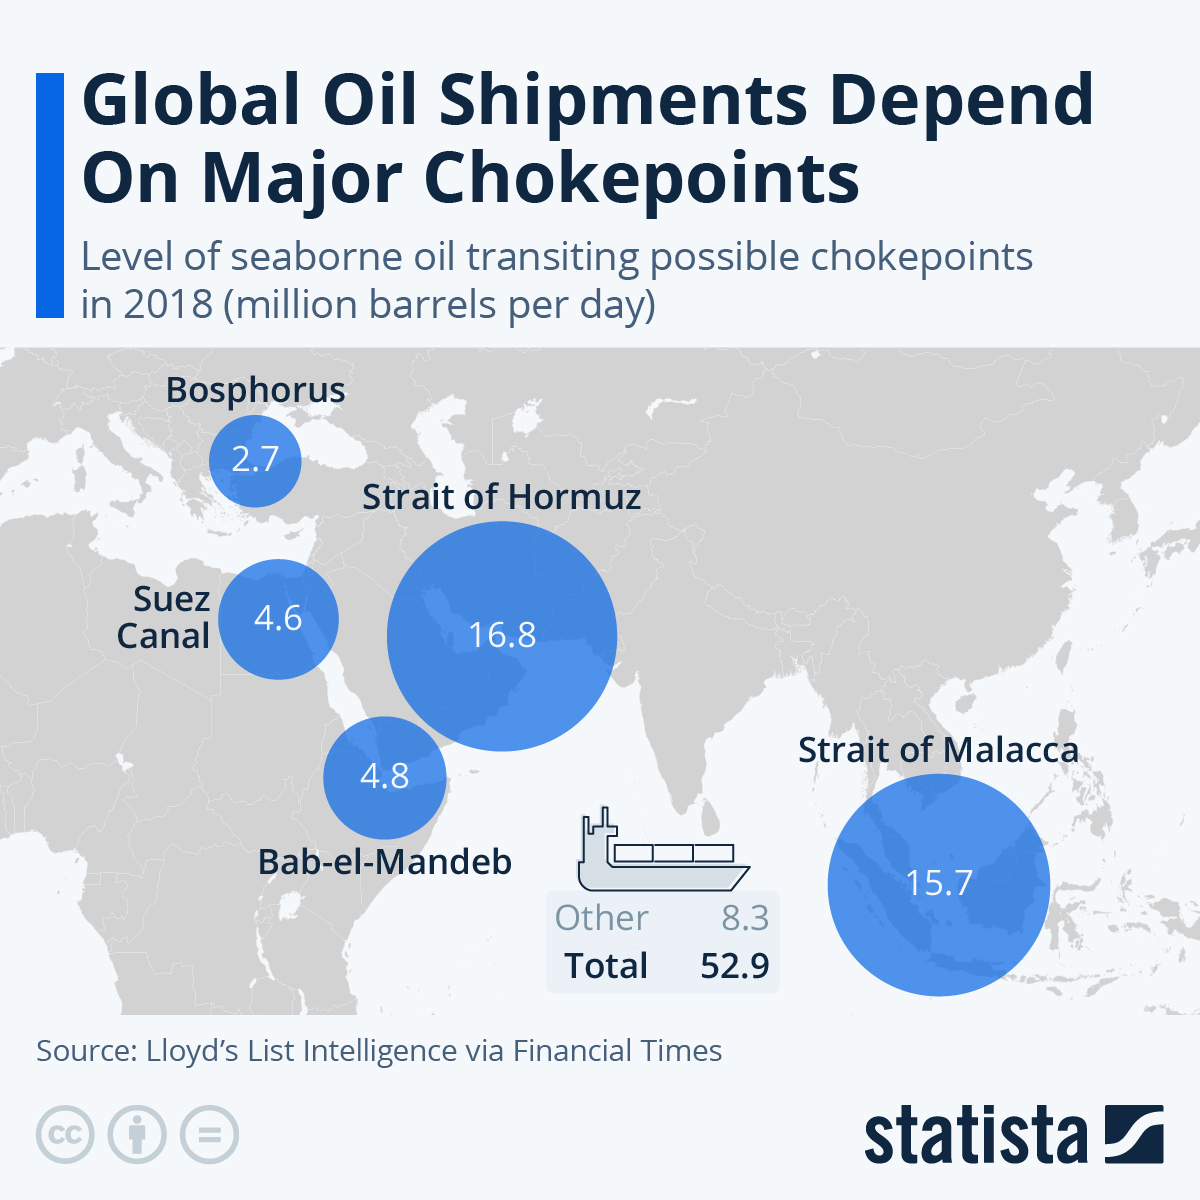
The Suez Canal is one of several key oil chokepoints around the globe and a Lloyd’s List Intelligence analysis published by the Financial Times found that 4.6 million barrels passed through it daily in 2018. That is still substantially less than some other vulnerable transit points around the world such as the Stait of Malacca which sees 15.7 million barrels pass through it and the Strait of Hormuz where nearly 17 million barrels pass per day.
The latter is still considered the biggest chokepoint to global supply and Iran has frequently threatened to shut it down over the years. Its strategic importance was illustrated on numerous occasions such as Operation Praying Mantis and the downing of Iran Air Flight 655 in 1988. Threats to shut down the Strait of Hormuz are taken seriously, particularly by the United States, and a heavy military presence is maintained in the region.
You will find more infographics at Statista where this article was originally published.

